Voters - Primaries and Caucuses (raw data by way of MSNBC).
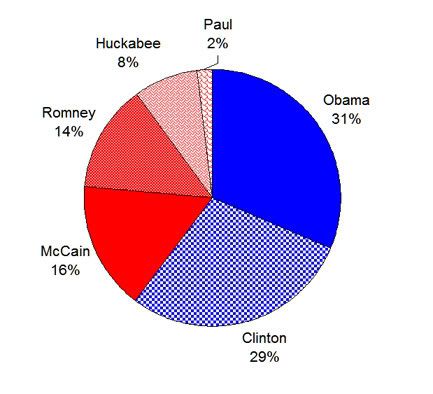
I took all the votes cast through the Super Tuesday primaries, both Republican and Democratic (and assumed that the drop-outs from both sides cancel each other out) to get some idea what participation is looking like. I don't know if it's any indication of what will happen in the general election but I suspect my prognostications are just as valid as those of any of the pundits (who've been consistently proven wrong throughout this election cycle so far). Of course, Romney & Paul dropped out of the race after Super Tuesday but, as a further assumption, the chart above is predicated on Republican voters continuing to vote Republican, and likewise for Democratic voters.
If the turnouts for the primaries and caucuses are any indication, it looks like there's a landslide building. It's looking more an more like 60/40 Democratic than 51/49.
So much for the 100 year Republican man-date.
I might be wrong, but it's worth thinking about.
No comments:
Post a Comment